M7.8 NEPAL on April 25th 2015 at 06:11 UTC
Last update: 25 June 2015 at 06:59 UTC
Earthquake details | Aftershocks locations | Intensity map | Quick map of the felt area
Comments posted by the witnesses | Send us pictures or videos | Epicenter location
|
EARTHQUAKE PREDICTION DOES NOT EXIST ! We have heard about rumors in Nepal that there has been some earthquake prediction. THIS IS NOT TRUE. There is no earthquake prediction today, it does not exist. Scientists are able in some cases to identify what is called seismic hot spots. Hot spots are areas where a large earthquake can be expected in time period ranging from tens to hundreds of years. But science is unable to predict when an earthquake will strike. Well known hot spots are for example, Istanbul, Tokyo or Los Angeles. |
M7.8 earthquake of April 25th
A very powerful earthquake of magnitude 7.8 hit Nepal on Saturday April 25th, 2015 at 06:11 UTC (11:56 Nepalese time). More information on the main shock is available here. The epicentre was located 80 north-west of Kathmandu.
The earthquake caused major damage in Kathmandu and in surrounding cities. The death toll exceeds 8,000 victims.
Many buildings in the region have been destroyed, including a number of centuries-old temples. A number of landslides have also been reported in the area and the earthquake also triggered a "huge avalanche" on Mount Everest, which killed at least 17 people at it's base camp.
The shake has been felt all over Nepal, India and Bangladesh as far as Kerala, India, more than 2,200 km away.
Read more:
- What caused the earthquake in Nepal ?
M7.3 earthquake of May 12th
On May 12th at 07:05 UTC (12:50 Nepal time) a M7.3 earthquake occurred at the eastern end of the rupture zone that caused the M7.8 of April 25th. This powerful earthquake made 66 victims and more than 1,000 injured.
More info about this earthquake here : http://www.emsc-csem.org/Earthquake/earthquake.php?id=441545
Comparison between April 25th and May 12th earthquakes
- Preliminary source study provided by CEA/DASE/LDG (Bruyères-le-Châtel, France):
18 teleseismic good quality GSN broadband waveforms are retrieved from IRIS servers and processed with the patch method (Vallee et al. 2004). For frequencies lower than 6 seconds, one patch of slip is sufficient to ensure a good fit between data (in black) and synthetics (in red) for both P waves (outer red ring) and SH waves (inner yellow ring).
The found fault plane is very similar to that of Mw7.8 25 April earthquake, with a bilateral rupture which extends in both South-East and North-West directions. The maximum amount of slip on the fault is about 2 meters and horizontal extension is about 60km. These results are preliminary, further work is needed to confirm these fast estimated fault parameters.
 |
 |
 |
- Moment tensors solutions
 |
 |
| M7.8 of April 25th | M7.3 of May 12th |
Aftershocks locations
The aftershock distribution shows a ruptures zones which starts from the main shock and extends approx. 150 km to the south-east (Figures 1 and 2).
Two of these aftershocks are of magnitude 6.7. The first occurred 34 minutes after the first shock and very close to it. The second occurred 25 hours after the main shock and 135 km away, at the other end of the rupture zone (Figures 1 and 2).
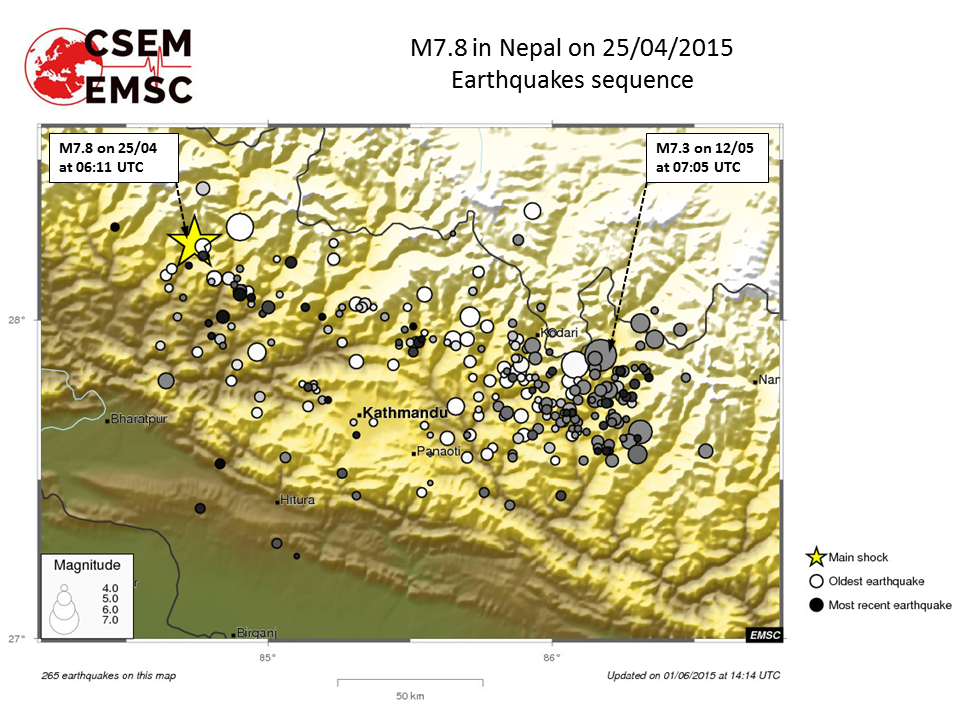 |
 |
| Figure 1: Aftershocks geographic distribution | Figure 2: Aftershocks and population density |
 |
 |
| Figure 3: Aftershocks time distribution |
Figure 4: Aftershocks rate |
Internet Earthquake Detection and map of the felt area
 |
 |
| M7.8 of April 25th | M7.3 of May 12th |
When an earthquake is felt by the population, the eye-witnesses rush on the internet to find out the cause of the shaking. When they reach EMSC website, we automatically detect the surge of traffic, locate the eye-witnesses thanks to their IP adress and map the area where the earthquake was felt.
This technique allows us to quickly detect felt earthquakes (within 1 or 2 minutes) and map the felt area before the first seismic data are available.
View it on YouTube: https://www.youtube.com/watch?v=gQ55br2R50c
Intensity maps
(generated with the results of the online questionnaire)
 |
 |
| M7.8 of April 25th | M7.3 of May 12th |
M7.8 of April 25th testimonies posted by the witnesses
 Loading, please wait...
You can click on the map' icons to view specific information.
Pictures or videos of damage
You were on the spot and you have taken photos or videos of earthquake effects (on buildings, ground, landscape), please send us your files. Send them by mail or upload them directly from your computer. Just click on the link below :
Send us pictures or videos of the main shock effects. After validation your files will be displayed on this page.
- Pictures provided by the eye-witnesses for the M7.8 earthquake of April 25th:
Loading, please wait...