Mw 7.7 PANAMA on October 9th 2026 at 17:56 UTC
Last update: 13 October 2026 at 11:53 UTC
Earthquake details | Seismic information | Aftershocks locations
Eyewitnesses data | Send us pictures or videos
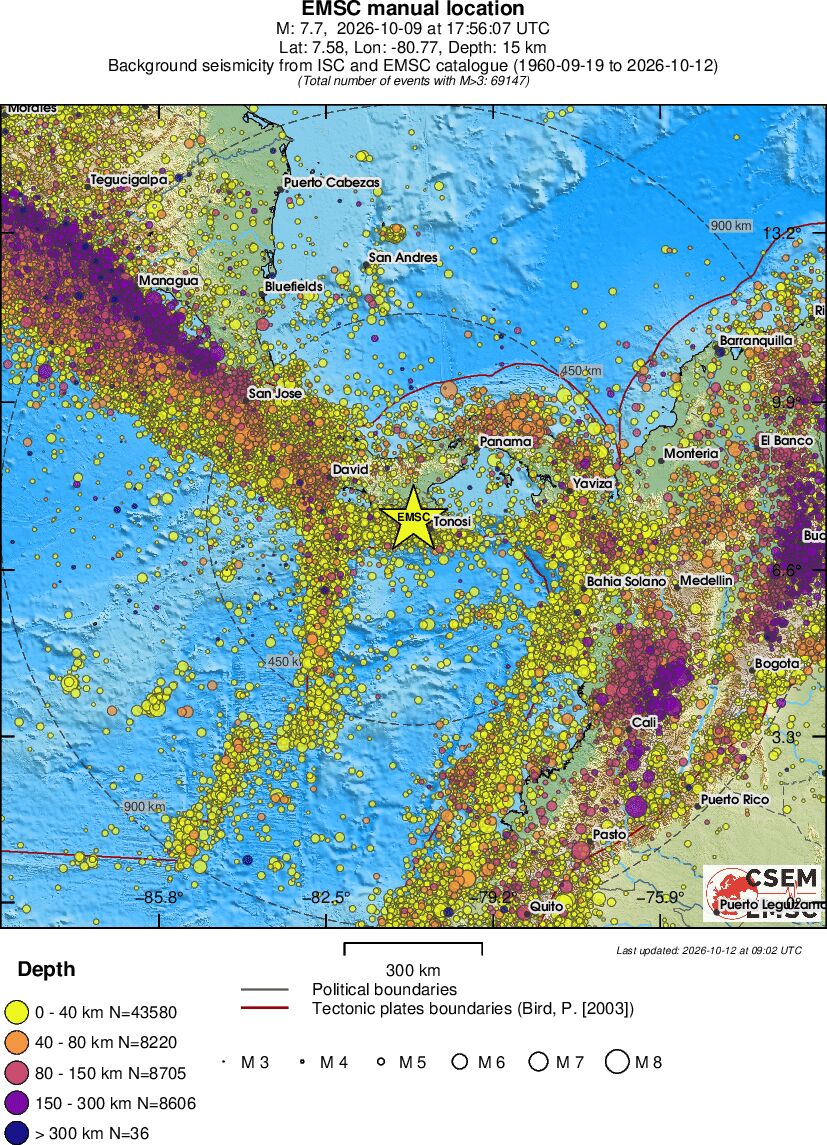
A magnitude Mw 7.7 earthquake struck PANAMA, about 209 km SW of Panama City, on 9 October 2026 at 17:56 UTC (12:56 local time, UTC−5). The epicenter was on the Azuero Peninsula, at a shallow depth of about 13 km. Seismological information is available here.
At the time of this report, more than 900 structures have been damaged, and local authorities report at least 27 people injured, with no fatalities or missing persons.
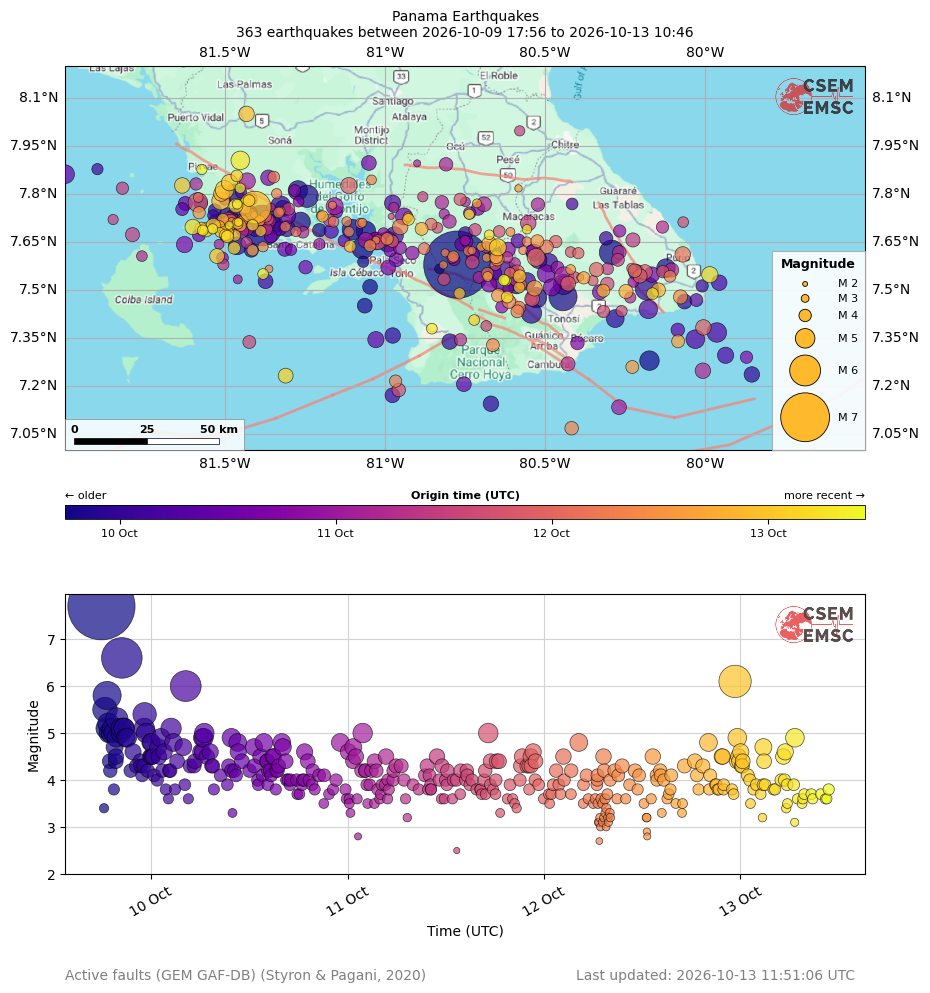
More than 360 earthquakes have been recorded in the 85 hours following the mainshock, including several of magnitude 6 or greater. Many of them have been felt by the population, including in Panama City.
If you felt this earthquake, please share your experience with us. Your testimony will be useful to update the Intensity map here below, where the felt intensities represent the effects of the earthquake over the impacted area.
 |
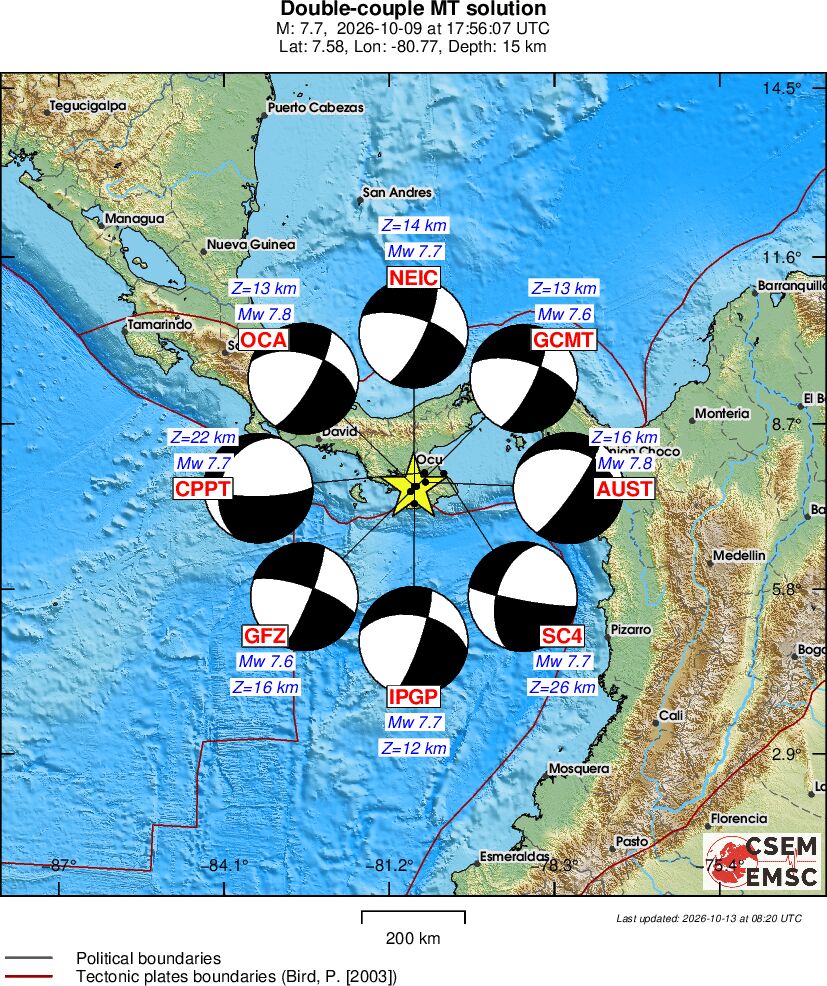 |
| Past Regional Seismicity as from the ISC catalogue (1964-2004) and EMSC Real Time catalogue (2005-today) | Moment tensors solutions received at EMSC |
After a large earthquake, many smaller earthquakes can occur in the area of the main shock. They are called aftershocks and are caused by the adjustment of the crust to the effects of the main shock. Below is a summary of the recorded aftershocks. It is likely that there will be more in the coming days. If you are in the affected area, please remain cautious.
The aftershocks extend over about 200 km from west to east, from west of Coiba Island to beyond Tonosí, along the Azuero–Soná fault system. The activity has also evolved over time. In the first hours, aftershocks occurred along the entire zone. Since then, the most recent earthquakes (yellow dots) have been concentrated in the western part, between the Gulf of Montijo and Cébaco Island, and near the mainshock epicenter
 |
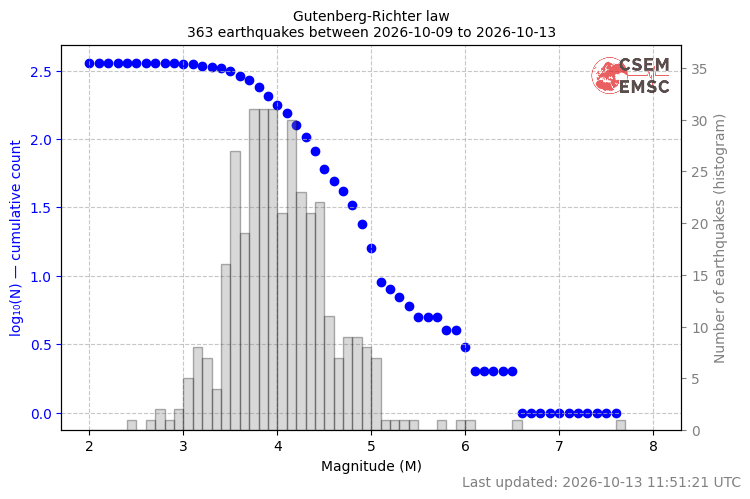 |
| Figure 1: Spatial and temporal distribution of the 363 earthquakes recorded by the EMSC between 9 October 2026 at 17:56 UTC (Mw 7.7 mainshock) and 13 October 2026 at 11:50 UTC. Top: map of epicenters; red lines are active faults from the GEM Global Active Faults Database (Styron & Pagani, 2020). Bottom: magnitude of each earthquake over time (UTC). On both panels, purple dots represent the oldest earthquakes in the series and yellow dots the most recent ones. The size of each dot is related to the magnitude of the earthquake. | Figure 2: Magnitude distribution of the 363 earthquakes of the sequence. Grey bars (right axis) show the number of earthquakes in each 0.1 magnitude interval. Blue dots (left axis) show the cumulative number of earthquakes with a magnitude greater than or equal to M, on a logarithmic scale (Gutenberg-Richter law). |
- Map of felt reports
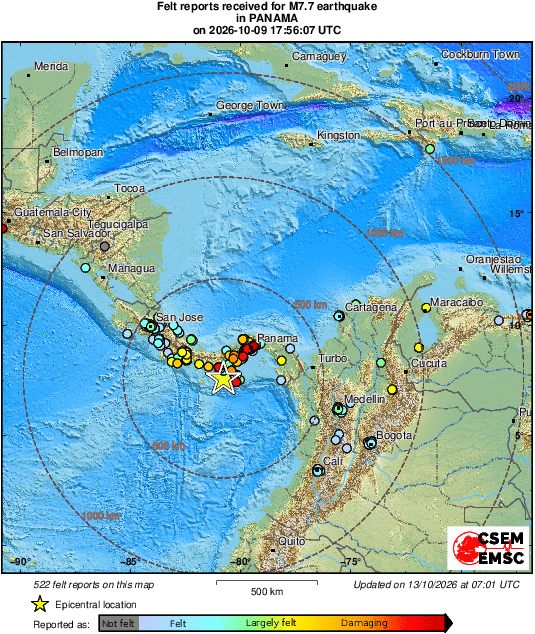
The EMSC collects testimonies from people who felt the earthquake. This information is collected through the LastQake mobile application, mobile or desktop website. The map below shows the testimonies collected by the EMSC for the main shock. Each coloured dot corresponds to a witness observation, which we call a "felt report". The redder the dot, the more intense the earthquake was felt.
By aggregating the reports, we can quickly map the effetcs of the earthquake.
|
|
- Curve Intensity / Distance
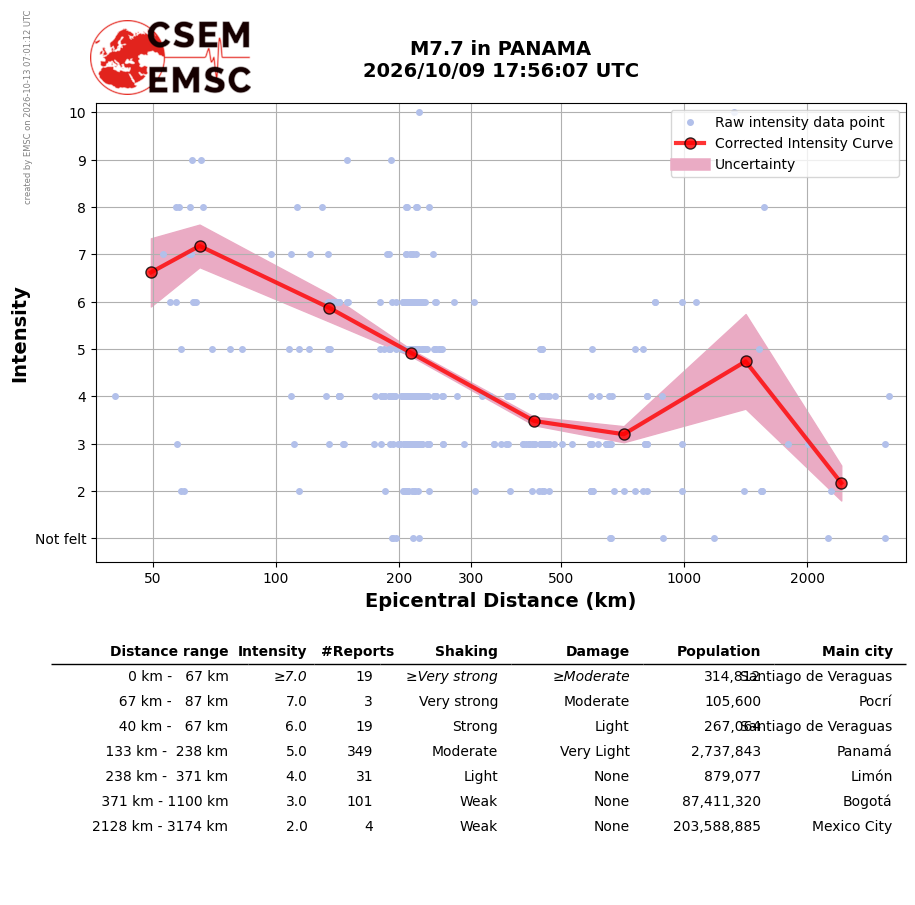
This graph shows the change in intensity as a function of distance from the epicentre. Intensity ranges from 1 to 12 and measures the observed effects of the earthquake in terms of shaking and damage at a given location. An earthquake is therefore associated with one magnitude and a variety of intensities, depending on where it is observed. For example, we can see that at a distance of 300 km from the epicentre, the average intensity is around 4. Moreover you can notice the general trend that the further you are from the epicenter, the less intensively you feel the earthquake.
 |
The EMSC also collects photos and videos from eyewitnesses. Combined with geolocation, these provide a picture of the situation and damage on the ground.
- Interactive map of pictures and videos