Mw 5.5 WEST OF GIBRALTAR on December 17th 2009 at 01:37 UTC
An earthquake of magnitude Mw 5.5 occurred on 17/12/2009 west of Gibraltar Strait, off Cape Saint Vincent at 01:37 (UTC and Portuguese time). More information on the main shock is available on the EMSC web site and from the Instituto de Meteorologia, Seismologia Lisbon, Portugal. The event occurred off the coast of South-Western Portugal.
The epicenter lies 256 km South of Lisbon, 183 km South-West of Faro. This event is the largest event in the region since the Mw 6.1 of 12/02/2007. This earthquake took place 80 Km North East of the 12/02/2007 main shock. It occurred in the region where the the 1755 Lisbon Earthquake presumably occurred.
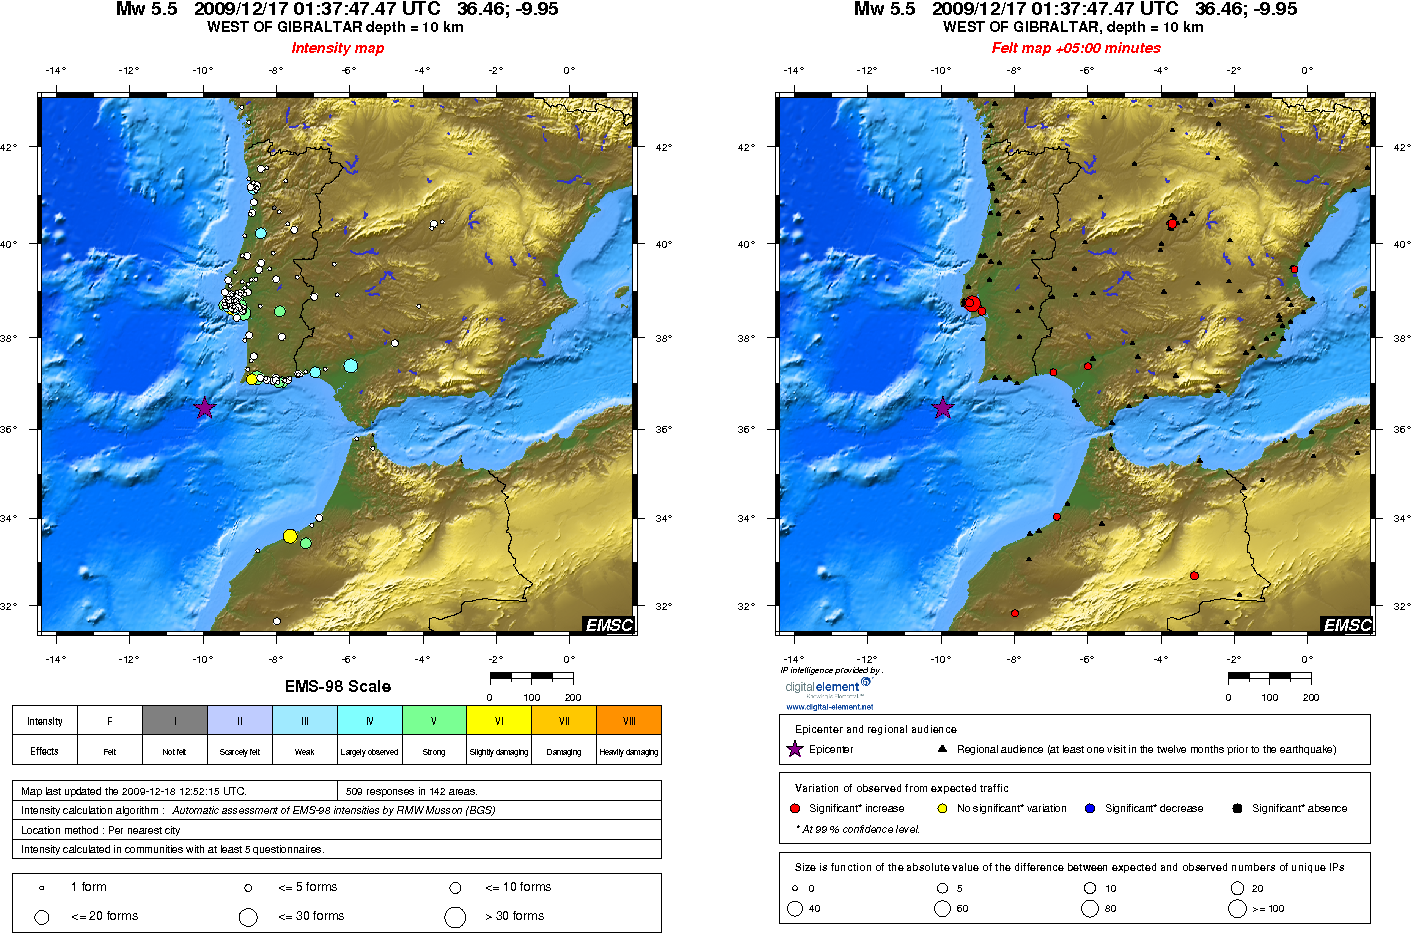
This earthquake has been widely felt in Portugal and in Morocco, as our macroseismic map and feltmaps show (Figure 3). It has been felt in Spain as far as Madrid (almost 800km away) in upper floors.
Answer our questionnaireIf you have experienced this earthquake, you are invited to answer the online questionnaire.Your testimony will be useful to update our Macroseismic map (on the right) which maps the effects of the earthquake. View the results of the questionnaires  |
 |
Send us pictures or videosIf you were in the area and have taken photos or videos of earthquake effects (on buildings, ground, landscape), please send us your files. You can send them by email, MMS or upload them directly from your computer. Just click on the link below :Send us pictures or videos of the main shock effects |
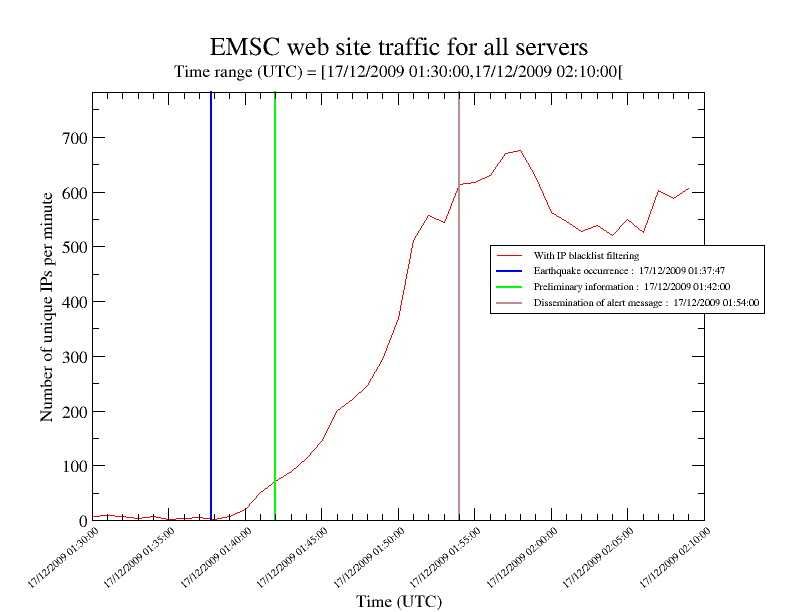
EMSC Web site Traffic variation
Over the past 5 years, the EMSC has developed mechanisms to use information captured from the EMSC web traffic to rapidly detect felt earthquakes and to map the extents of their effects. When an earthquake is felt, people turn to the internet to find out more. This in turn produces a surge in web traffic which is automatically detected (Figure 1.) Using Digital Element’s IP localization technology, we are able to identify the location from which the traffic originates. From this information, we automatically build “feltmaps” (Figure 2) – maps ofwhere the earthquake has been felt. Significant absence of traffic from areas can indicate severe damage in those regions. Using these methods, we can detect the occurrence of an event in populated areas typically within 2-3 minutes, generally before we are able to publish the first automatic earthquake location using seismological data. These mechanisms respond to community input in the form of increased web traffic to rapidly detect events that are significantto the population and to map the extents of the effects.

 |
 |
References:
- Citizen seismology page: http://www.citizenseismology.eu
- Video on EMSC Citizen Seismology: http://www.youtube.com/watch?v=wunAHj1KztQ
- Bossu R., Internet Users as Seismic Sensors for Improved Earthquake Response. EOS, Transactions, AGU, Vol. 89, No. 25, 225-226
- Web hits used to pinpoint earthquakes, New Scientist, 30/06/2008: Highlight on the earthquake detection technique used by the EMSC.
- European center tracks Web site hits after earthquakes, Government Computer News, 17/04/2009. Introducing the EMSC method of using IP addresses to locate earthquakes.
- A Seismic Shift in Earthquake Detection: Tracking Early Impact Through the Internet, 06/04/2009, by Digital Element (read the press release). Digital Element partnership for the detection of the IP location of EMSC web users.
Epicenter location and regional seismicity
 Figure 5: Epicenter Location |
 Figure 6: Moment Tensors Solutions |
 Figure 7: Past Regional Seismicity as from the ISC catalogue (1964-1998) and EMSC catalogue (1998-today) |
Aftershockslocations
 Loading, please wait...
Aftershocks distribution from the main shock until 21/12/2009 08:00 UTC.