Mw 9.0 off the Pacific coast of Tohoku, Japan Earthquake, on March 11th, 2011 at 05:46 UTC
Last update: 27 February 2012 at 13:23 UTC
Earthquake details | Liquefaction | Felt & Damage reports | Tectonic settings | Tsunami information | Aftershocks locations
Seismograms showing the Earth' normal modes | Send us pictures or videos | Epicenter location
![]()

Earthquake details
On March 11th, 2011, an earthquake of magnitude Mw 9.0 occurred off the Pacific coast of Tohoku, Honshu Island, Japan, at 14:46 local time (05:46 UTC.) More information here. It has been followed by a series of powerful aftershocks, with 31 earthquakes of magnitude larger than 6 in 3 days.
The earthquake epicenter is located approximately 100 km off Miyagi at a depth of 22km. It was widely felt as far as Tokyo, about 400 km away. A tsunami wave was generated in the Pacific, with wave heights reported at more than 4 m high. The Yomiuri daily newspaper reports that the tsunami waves reached at least 23m according to a study by the Port and Airport Research Institute in Ofunato (Iwate prefecture).
This is the largest earthquake ever recorded in Japan, and is among the 5 largest earthquakes recorded worlwide.
Two days earlier, on March 9th, another large earthquake occurred in the same area, approximately 35 km away from the main earthquake March 11th. More information is available at the EMSC and at the USGS.
On April 7th (14:32 UTC), a strong aftershock (Mw 7.1) occurred 50km west of the main shock.

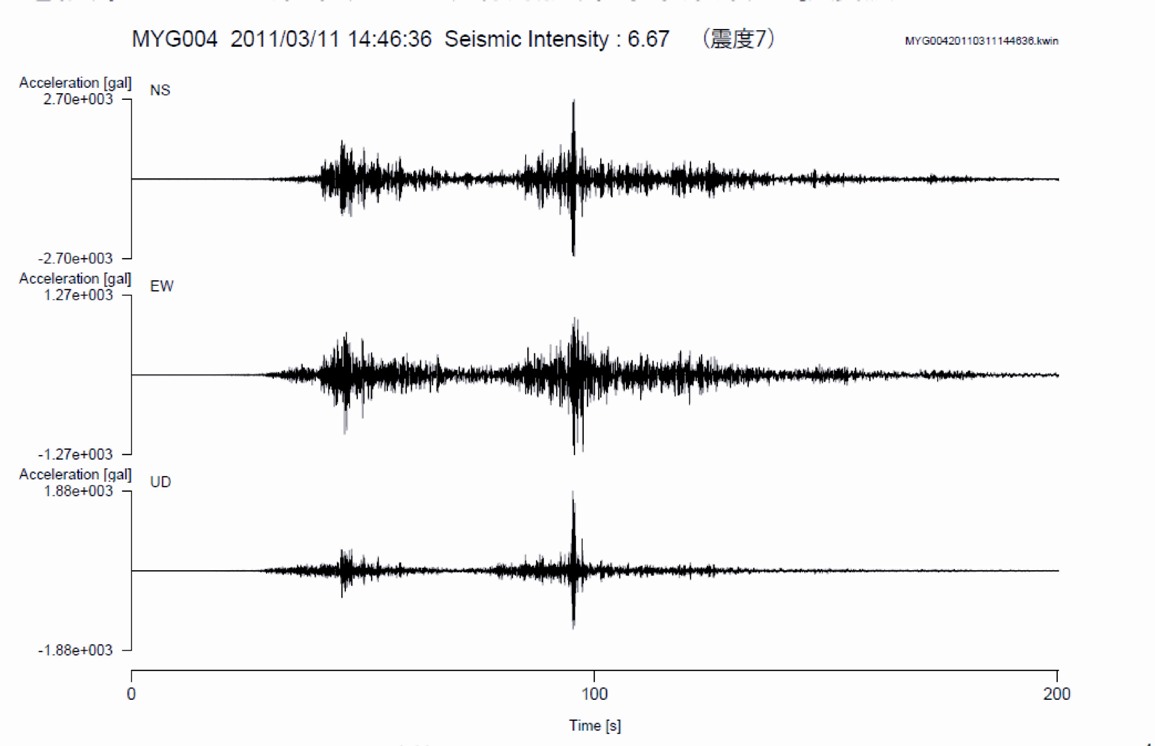
Peak Ground Acceleration (NIED)
Acceleration recorded at station MYG004 displaying the largest PGA measured (this KNET station is located near Kurihara)

Observed (black) and predicted (red) horizontal GPS displacements (Caltech- JPL ARIA group)
More information here:
http://www.tectonics.caltech.edu/slip_history/2011_taiheiyo-oki/

Source: Eric Kizer, Harvard University, USA
A preliminary modelisation of the USGS gives a surprisingly short rupture length of about 300 km along strike, with a southward direction along the Japan Trench and 150 km downdip. The displacement is evaluated to 17m. If this rupture length is confirmed, it proves to be short for a magnitude 9 earthquake.

Preliminary USGS rupture modelisation
Caltech University confirms this hypothesis with a 300 km rupture length but with a displacement of 30m.

Preliminary Caltech rupture modelisation
More information:
General information:
 EMSC mainshock information
USGS special publication
Iris Teachable moment presentation
 IPGP (Paris, France) special web page
ERI (Earthquake Research Institute - University of Tokyo, Japan) web page
IISEE (International Institute of Seismology and Earthquake Engineering, Japan) web page
CEA/LDG special web page (in french)
IRSN (France) note on the Japanese seismic event (in french)
AFPS (French Association for Earthquake Engineering) dedicated web page
Additional scientific information on this event are available at GEO Geohazards Supersite including GPS, Ground Motion, Slip distribution
More scientific & public information (ERI)
Institut des Sciences de la Terre special page (in french)
CNRS/INSU special page (in french)
Comments on the earthquake
Specific analysis:
Fast teleseismic body-wavesource inversion (by Martin Vallee; Geoazur, Nice, France)
Preliminary modeling of the source of the March 11, 2011, by retro-propagation of P waves (Claudio Satriano – IPGP)
Mainshock location, magnitude and tsunami potential determinations in real-time at INGV (Alberto Michelini, INGV, Anthony Lomax, ALomax Scientific)
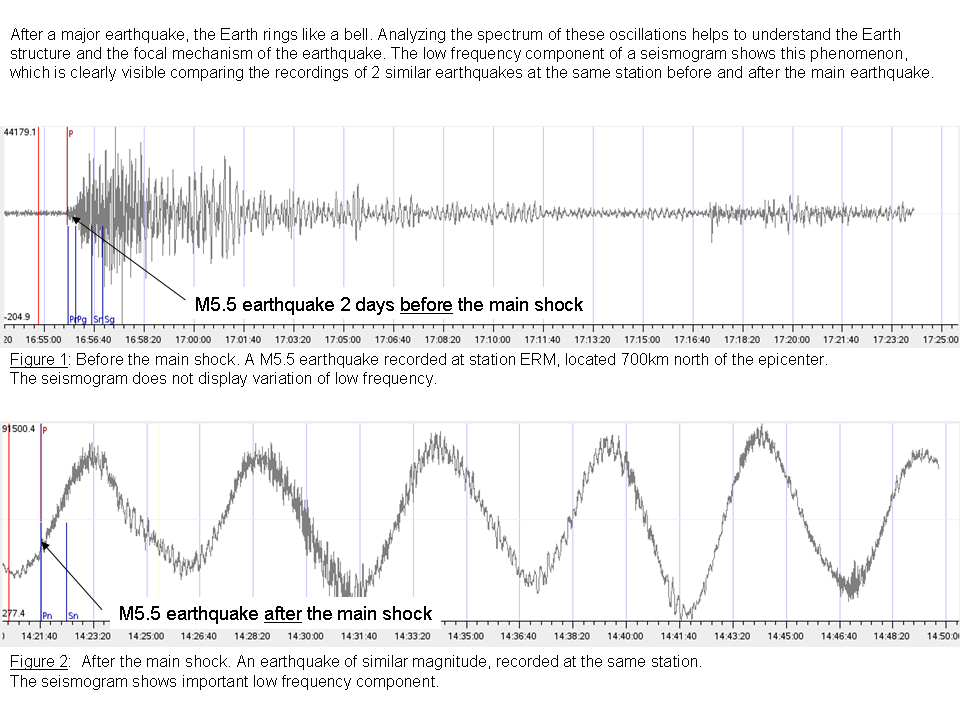
The Earth eigenmodes excited by the Japanese earthquake (by van Camp and Rivera; ROB and EOST, Belgium and France)
Co-seismic displacement at surface using the USGS epicentre + slip model and an Okada code for elastic deformations and Coulomb stress transferred on optimal planes to regional compression (N115E) using the USGS epicentre + slip model and the code DLC (from Bob Simpson, USGS) (A. Ganas, NOA, Greece)
Co-seismic displacements at two japanese stations (K.Chousianitis and A. Ganas, GEIN, NOA, Greece)
National Seismic Hazard map for Japan (2005)
Preliminary slip model using Strong Motion stations and ISOLA code (J. Zahradnik, F. Gallovic, CUNI, Czech Republic and E. Sokos, G-A Tselentis, UPatras, Greece).
Liquefaction effects
Liquefaction effects have been observed in several places in Japan. (Updated 2011-04-11)
|
|

In Japan, Shaken Soil Turned Soft After Quake (by JON HAMILTON. Source: NPR ) |
|
|


Felt & Damage reports
Witnesses report that the shaking lasted for about 2 minutes. It was largely felt across the entire Honshu Island, and as far away as Osaka.
Massive damage has been reported, mainly related to the subsequent tsunami.
The nuclear power plant of Fukushima has been strongly affected by the tsunami. More information about the nuclear accident are available at:
IRSN note on the nuclear power plant situation (in french)
IAEA note on the seismic and nuclear situation
Video: ![]() Shaking Yokoama (Source: Le Post)
Shaking Yokoama (Source: Le Post)
Satellite photos before and after the earthquake (Source: New York Times) and here (Source: Media Tools)
 |
 |
| JMA has issued a map of intensity showing a maximum for Kurihara City of Miyagi Prefecture |
JMA Seismic Intensity Scale More information on the JMA scale |

MEGA DISASTER IN A RESILIENT SOCIETY: (updated 2011-04-11)
The International Environment and Disaster Management Laboratory of Japan has published a detailed report on the earthquake and its consequences, adressing the major challenge of disaster risk reduction. The report provides scientific observations, damages information, humanitary organisation (rescue and shelter), as well as the expected economic impact for Japan. The aim of the report is to synthesize certain existing data with basic situation analysis.
Tectonic settings
The earthquake involved a thrust fault with displacement up to 15 m.This region is located on the subduction zone boundary where the Pacific Plate subducts beneath the Eurasian Plate. The pacific plate moves approximately westward with respect to the North American plate at a velocity of 83mm/year.
More information are available here: http://pubs.usgs.gov/of/2010/1083/d/
 |
|
|
Source: USGS The 03/11/2011 earthquake occurred near the east coast of Honshu, it is the result of thrust faulting about 200km west of the subduction zone (Japan Trench). This boundary corresponds to the Pacific plate diving below the Eurasian plate |
Source: Modified from: L. Jolivet, ISTO, Orléans, France
The Philippine Sea Plate, supporting the Bonin Arc, dives beneath the Eurasian plate at the Nankai Trench. |

The previous major event in the region occurred on March 2nd, 1933 with magnitude Mw 8.4 on the Sanriku coast, which also generated an important tsunami. It was located 140 km North East of the 2011 March 11th earthquake.
In January, 1995, a magnitude 6.8 earthquake occurred nead Kobé (West of Japan), which was the most damaging and deadly earthquake in Japan at that time.
Tsunami information
The major aftermath tsunami has swept Japan and the Pacific Ocean. More details are available at the NOAA Center for Tsunami Research: http://nctr.pmel.noaa.gov/honshu20110311/ The buoy measurements report a 7.3m high wave in Soma, south of Sendai according to JMA. This is highest wave measurement ever. Several instruments, among which one in Fukushima have been destroyed. This tsunami has devastating consequences in the region of Sendai and Northern Honshu. However the wave travelling across the Ocean, reaching Hawaii, French Polynesia or the Coast of Northern and Southern Americas has not generated significant damages.
 |
 |
| The Japan Meteorological Agency provides more information about the tsunami. |
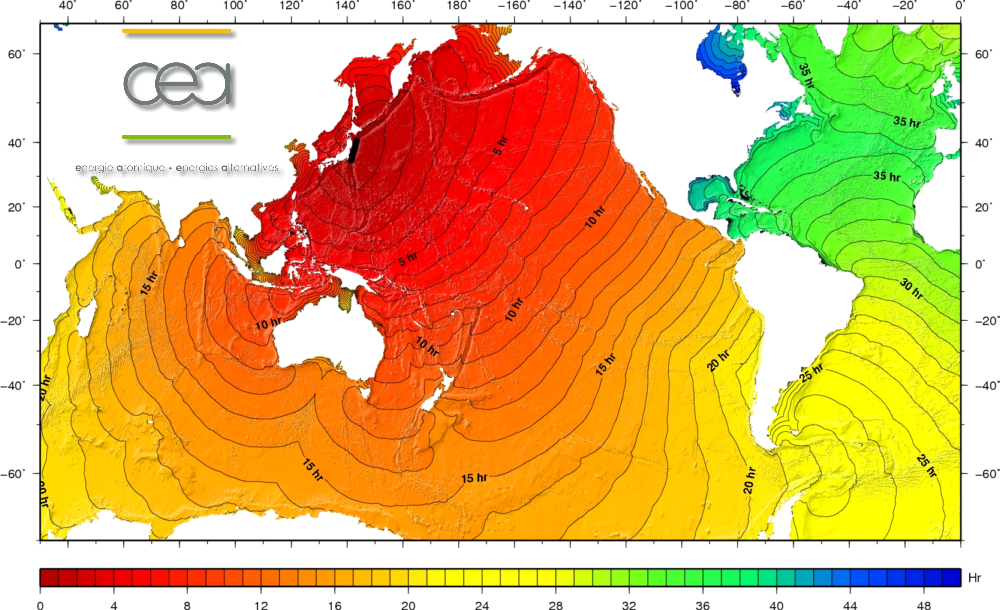
Tsunami Travel Time Modelisation for the Honshu earthquake (Hélène Hébert, CEA, France) The wave travels over the whole oceanic system, reaching the Atlantic approximately 20 hours after the earthquake. |
 |
| Source: BBC |
Japan Meteorological Agency Tokyo, Japan
Pacific Tsunami Warning Centre Hawai, USA
 |
 |
|
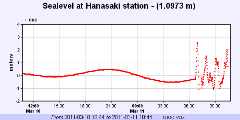
Sea level monitoring in Hanasaki, Japan Source: IOC, other measurements available |
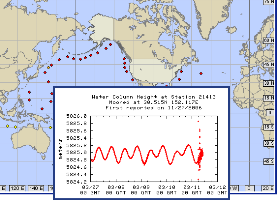
Water column height Source: NDBC/NOAA |
Tsunami wave recordings at French Polynesia and New Caledonia's buoys
Photos of the tsunami (source: BBC) Satellite images before and after the tsunamiThe Joint Research Center of the European Commission (JRC) has issued a map of the inundation which shows how far the was travelled inland. [Link]

Aftershocks locations
 Download as KML (Automatic update - requires an internet connexion)
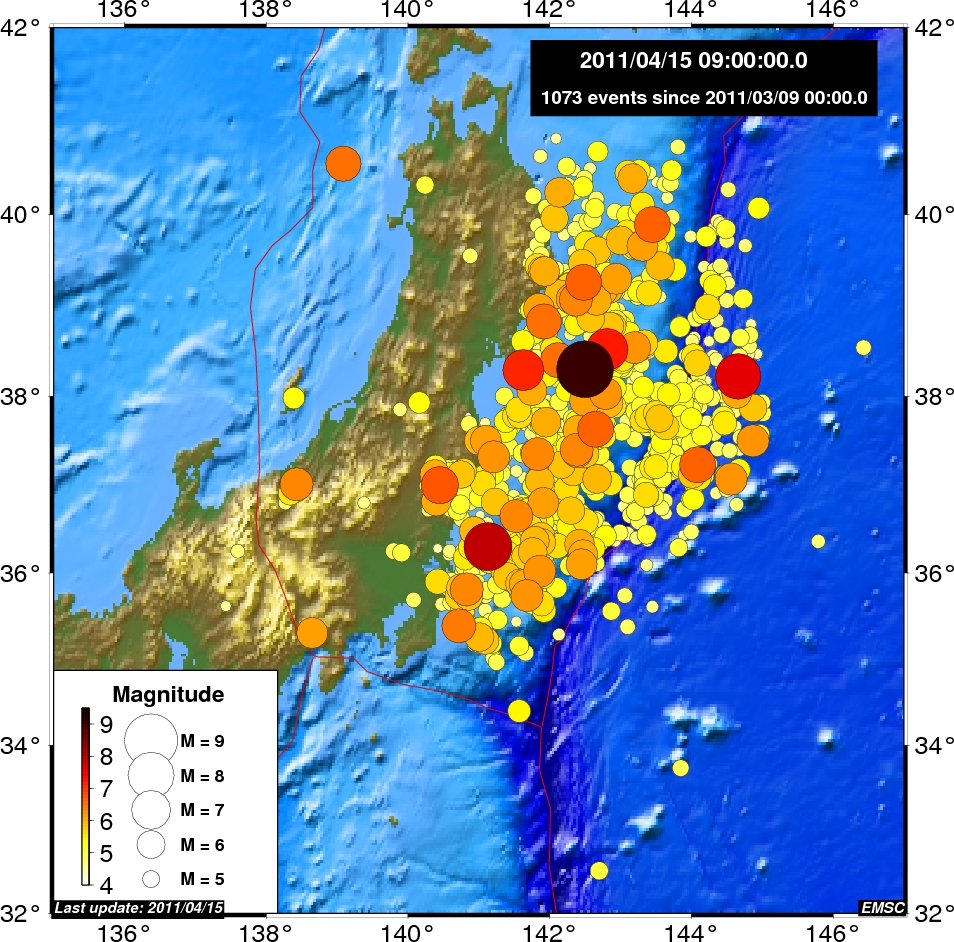
The animated aftershocks map shows the progression of the seismicity since March 9th to date. A foreshock of magnitude 7.2 occurred on March 9th, followed two days later and about 40km to the south-west, by the earthquake of magnitude 9.0 (red circle). Both events occurred about 100km west of the Japan Trench.
Frequent aftershocks continue to be recorded, generally following a North-East South-West axis, also off the Japan Trench. Their locations extend over 400km, delimiting the extents of the rupture zone.
On the right is displayed the magnitude progression of the earthquakes over time. After the foreshock and the main shock, a large number of events are recorded whose magnitudes decrease over time, following Omori's law.
 |
 |
 |
|
Geographic distribution of seismicity in Northern Japan since 09/03/2011 View animation (last update 15/04/2011 09:00 UTC) |
Earthquake sequence off coast of Northern Japan |
Number of earthquakes with magnitude larger than a given value (see Gutenberg-Richter law) since 09/03/2011 to 12/04/2011 |
 |
 |
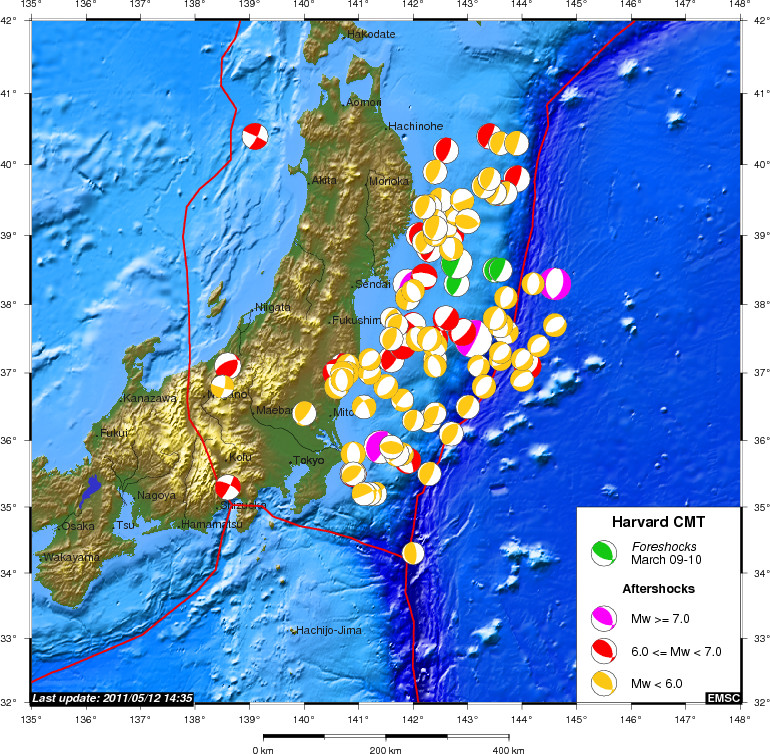
| Centroid Moment tensors associated with the earthquake equence of Northern Japan since 09/03/2011 (source: Harvard) |
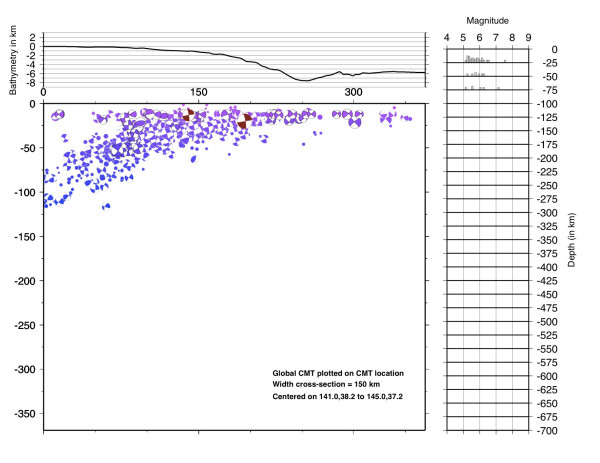
Cross section of the seismicity since 11/03/2011 (source: Harvard) |
Earth' normal modes
 |
|
|
An application that illustrates the Earth' Normal Modes by Lucien Saviot (http://icb.u-bourgogne.fr/Nano/MANAPI/saviot/) of the University of Bourgogne, France. Use this application to see how the normal modes deforms the Earth |
 |
Send your pictures of the damages via RICHTER (free application for Androidmobiles). More...
You were on the spot and you have taken photos or videos of earthquake effects (on buildings, ground, landscape), please send us your files. Send them by mail, MMS or upload them directly from your computer. Just click on the link below :
Send us pictures or videos of the main shock effects
After validation your files will be displayed on this page.
Epicenter location
 Main Shock Epicenter Location |
 Past Regional Seismicity as from the ISC catalogue (1964-2004) and EMSC Real Time catalogue (2005-today) |
 Quick Moment Tensors |
Share scientific information
If you have scientific materials you wish to share and display on the EMSC web site, please contact us at: